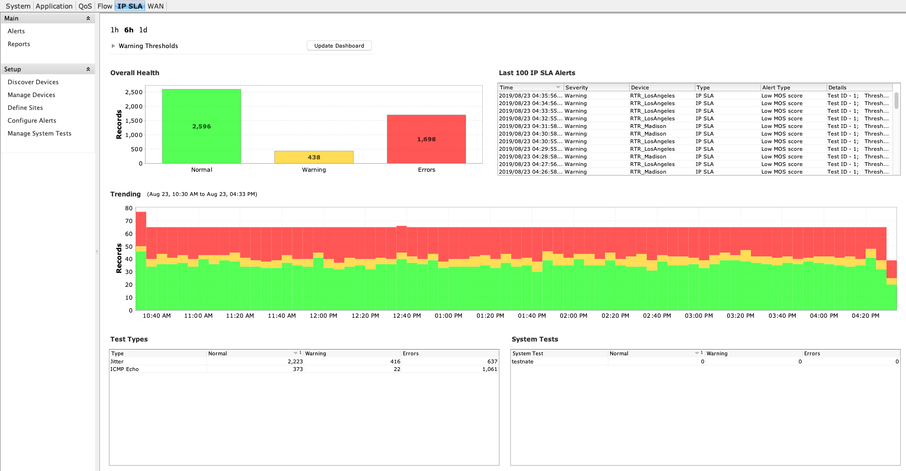
IP SLA Dashboard
The IP SLA Dashboard presents a snapshot of the IP Service Levels that are active within the network, it lists the Thresholds in the past Hour, 6 Hours, or 1 day. It displays the Overall Health, the last 100 Alerts, Trending of the Alerts and type of Alerts. Within each widget the order can be displayed from Highest to Lowest, or vice-a-versa by clicking on the title bar within each widget.
Right-clicking in any of the widgets will give you the option to view the Pre- and Post-Policy graphs for the policy selected.
Click on the + sign next to Warning Thresholds to customize the dashboard parameters. This is a Warning message specific to the IP SLA technology and does not generate alerts in the LiveNX system.
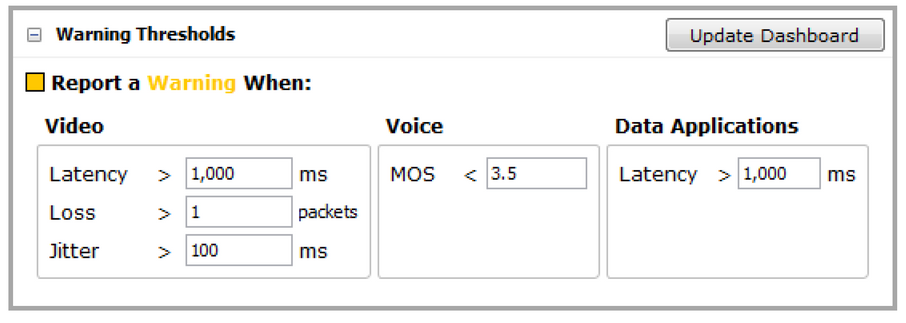
• Video test types include telepresence, IP TV, and VSC. Latency, loss, and jitter values are configurable, allowing you to fine-tune the test to your needs.
• The MOS score is used to determine health.
• Data applications are a collection of IP SLA test types, including, DNS, DHCP, HTTP, FTP, PATH_ECHO, UDP_ECHO, and ICMP_ECHO tests. Latency is the most important value for these tests.
The overall health chart displays a running count of the health values of each test attempt across all devices in the application. Any records that exceed the thresholds defined in the Warning Thresholds section of the IP SLA dashboard will appear as a warning.
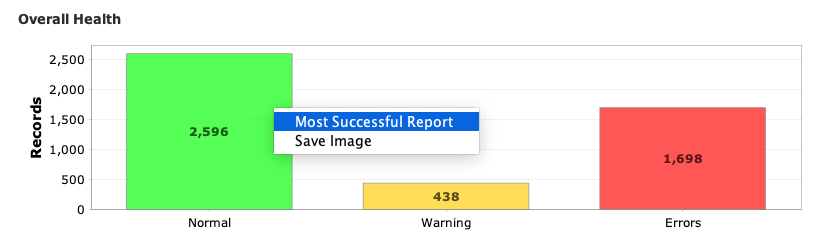
Right click on the bar chart to select most Successful/Warnings/Errors Report and save an image.
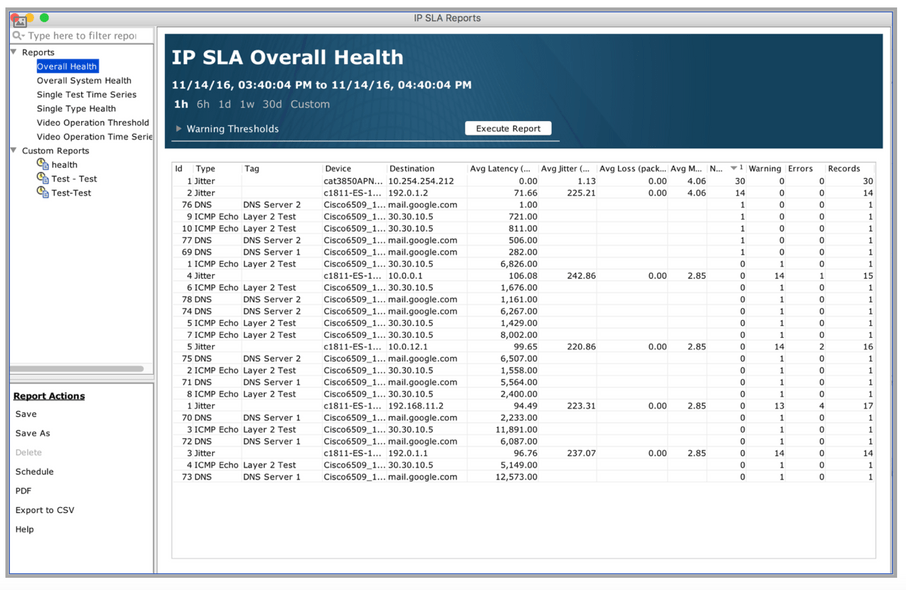
IP SLA Overall Health report: depending on the bar chart selected, LiveNX generates an IP SLA Overall Health report sorted by Normal in highest to lowest order if you right clicked on the Normal bar, Warning in highest to lowest order if you right clicked on the Warnings bar, and Errors in highest to lowest order if you right clicked on the Errors bar.
Save image: create a .png file of the bar chart for saving.